

When people ask AI tools what to buy, the sources cited are not mainly retailers' own sites. Tinuiti's Q3 2026 citation data, built on Profound's tracking, says the top 100 ecommerce sites account for 12% of citations, social media accounts for 14% of citations on apparel prompts, and Google increasingly cites its own pages in AI Mode. This post explains what those numbers can and cannot tell you, and what a store should check this month.
What is the Tinuiti report?
Tinuiti publishes an AI Citation Trends report. The Q3 2026 page describes data "so far in Q3," so it is a partial-quarter snapshot. The data comes from the Profound platform, which tracks AI citations across product categories over time using prompts in each tracked category.
It covers ChatGPT, Perplexity, Google AI Mode, Google AI Overviews, Gemini and Microsoft Copilot. Categories include apparel, beauty, electronics, food and beverage, home and garden, manufacturing, OTC health, technology, and transportation and logistics.
The page does not state a sample size or the number of prompts. That detail may sit in the gated full report, which we have not seen. It also does not give per-platform share figures on the public page. Everything below is from the public page.
What does the report say about shopping?
Four findings, as stated on the page:
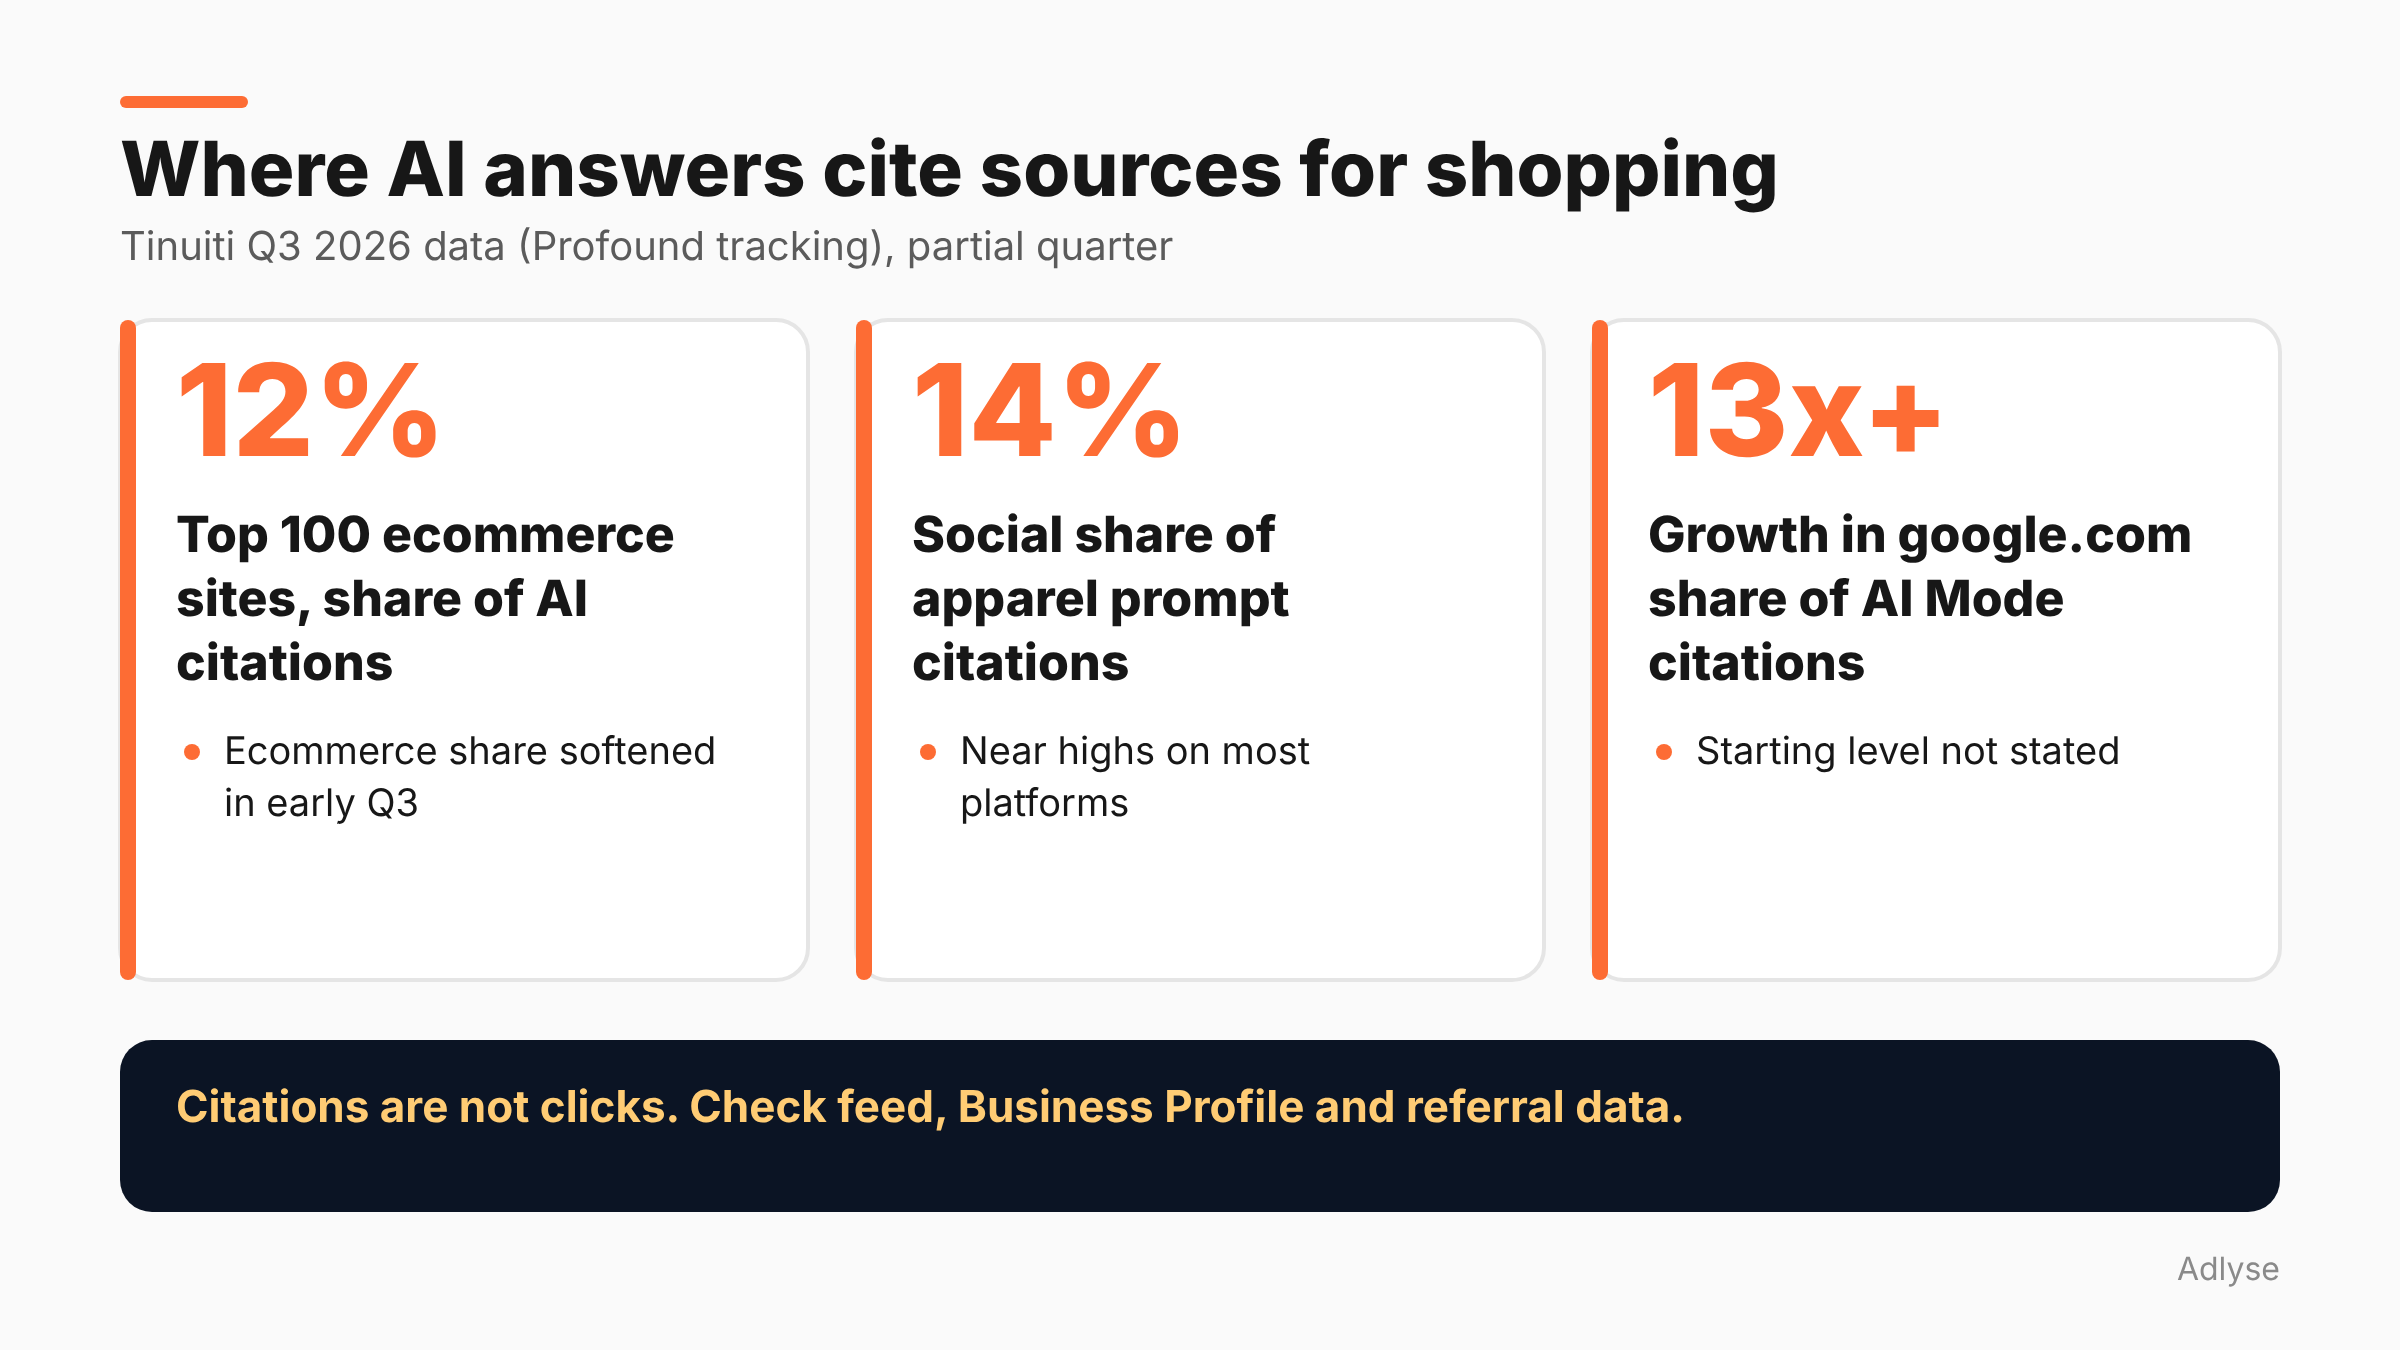
- Ecommerce is a small slice. The top 100 ecommerce sites account for 12% of AI citations.
- Ecommerce share softened in early Q3. A little under half of that decline is attributed to Amazon.
- Social is large in apparel. Social media accounts for 14% of AI citations on apparel prompts.
- Social is near highs almost everywhere. Most platforms are at or near all-time highs in social citation share. Perplexity is an exception.
Note what is not there. The page does not tell you which retailers are cited most, how often a cited store gets a visit, or whether a citation led to a sale.
Why is Google citing Google?
Per the report, Google is increasingly citing its own properties, such as YouTube, Google Business Profiles and product cards on google.com, particularly in AI Mode. It says google.com's share of AI Mode citations has grown more than 13 times this year.
Read that carefully. A share that grows 13 times can start from a small base, and the page does not give the starting level. It also does not say how Tinuiti counts a product card as a citation.
The practical point is less about the number and more about the direction. If Google's answers lean on Business Profiles and product cards, your Merchant Center feed and your Business Profile matter in these answers. Google's AI optimization guide says the same in plainer words: use Merchant Center and Business Profiles to help products and local businesses appear in AI responses.
What does this mean for a store?
This section is our opinion, built on the figures above.
Your own site is one source among many. If 14% of apparel citations go to social, then videos, posts and creator content are part of how your product gets described. You do not control all of it.
Product data is a citation surface. Prices, availability, titles and images in your feed feed Google's product cards. Errors there are errors in the answer.
Third-party mentions matter, but cheap ones do not. Google's guide says seeking inauthentic mentions across the web "isn't as helpful as it might seem." Do not buy your way into answers.
Do not assume the citation is the sale. A citation is a mention. Whether it sends a visit is a separate question that the report does not answer.
What should you check this month?
- Feed health. In Merchant Center, check for disapproved items, missing GTINs and price mismatches with your site. Do this before the holiday peak.
- Business Profile. If you have physical stores, check hours, categories and photos.
- Your own prompts. Ask the main AI tools the ten questions a buyer would ask about your category and note which sources they cite. Do it on a set day each month so the results compare. This is a manual check, not a measurement, and answers vary between runs.
- Social presence. Look at what appears about your product on the social platforms people cite in your category. Reviews, demos and unboxings are citable.
- Landing pages. Make sure product pages state the facts a shopper asks: size, material, price, delivery, returns. A page that answers plainly is easier to cite.
- Referral data. Check your analytics for traffic from AI tools to product pages. If you do not segment it yet, start with a simple rule for the sources you recognize.
For what to do about ads that now sit beside these answers, see our guide to automated advertising workflows.
How should this change paid budgets?
It should not, by itself. A citation share is not a conversion rate. But it should change what you ask your paid team.
Ask where buyers learn about your product before they search for it. If the answer includes AI answers and social content you do not control, the first touch may not show up in last-click reporting. Our post on why ROAS misleads across platforms explains why. A holdout or geo test, as described in our incrementality testing guide, is a fairer way to read it.
During peak season, do not rebuild budgets around a citation report. Keep your plan, and use the report to decide what to test in January. Our Q4 and BFCM pacing plan covers the pacing side.
What are the limits of this data?
- One vendor's tracking. It is Tinuiti's reading of Profound's data. Other trackers will show different numbers.
- Prompt choice matters. The result depends on which prompts were tracked, and the page does not list them.
- A partial quarter. The numbers describe the early part of Q3.
- Citations are not clicks. The page has no click data.
- We have not seen the full report. Open it before you quote any figure beyond those above.
What should you do next?
Pick one product category and run the ten-question check this week. Write down what is cited, then check your feed for the products involved. If you run changes through Adlyse, each approved change ships with a hypothesis and is graded improved, hurt or neutral. Treat a feed fix the same way: state the expected effect, then check it.