How Do I Understand What Is Working and What Is Not in My Google Ads Campaigns?
Higher ROAS. 10x less work.
Put Adlyse on your accounts. Daily audits, agentic optimization, and reports your clients actually read.
Request a demoFocus on performance signals tied to business goals
To understand what's working and what's not in your Google Ads campaigns, you need to focus on performance signals tied to your business goals, not just raw numbers. The key is to evaluate the right metrics like conversion rate, cost per acquisition (CPA), and return on ad spend (ROAS), compare them to relevant benchmarks, and analyze trends over time using reliable tools like Google Ads reports and analytics platforms.
This answer appears right up front because when marketers don't track the right metrics consistently and contextually, it becomes nearly impossible to tell whether campaigns are actually driving real value versus just generating clicks or impressions. With the right approach and tools, you can clearly see what's working, what's not, and why.
What "Working" Actually Means in Google Ads
When you ask "Is this campaign working?", you're really asking:
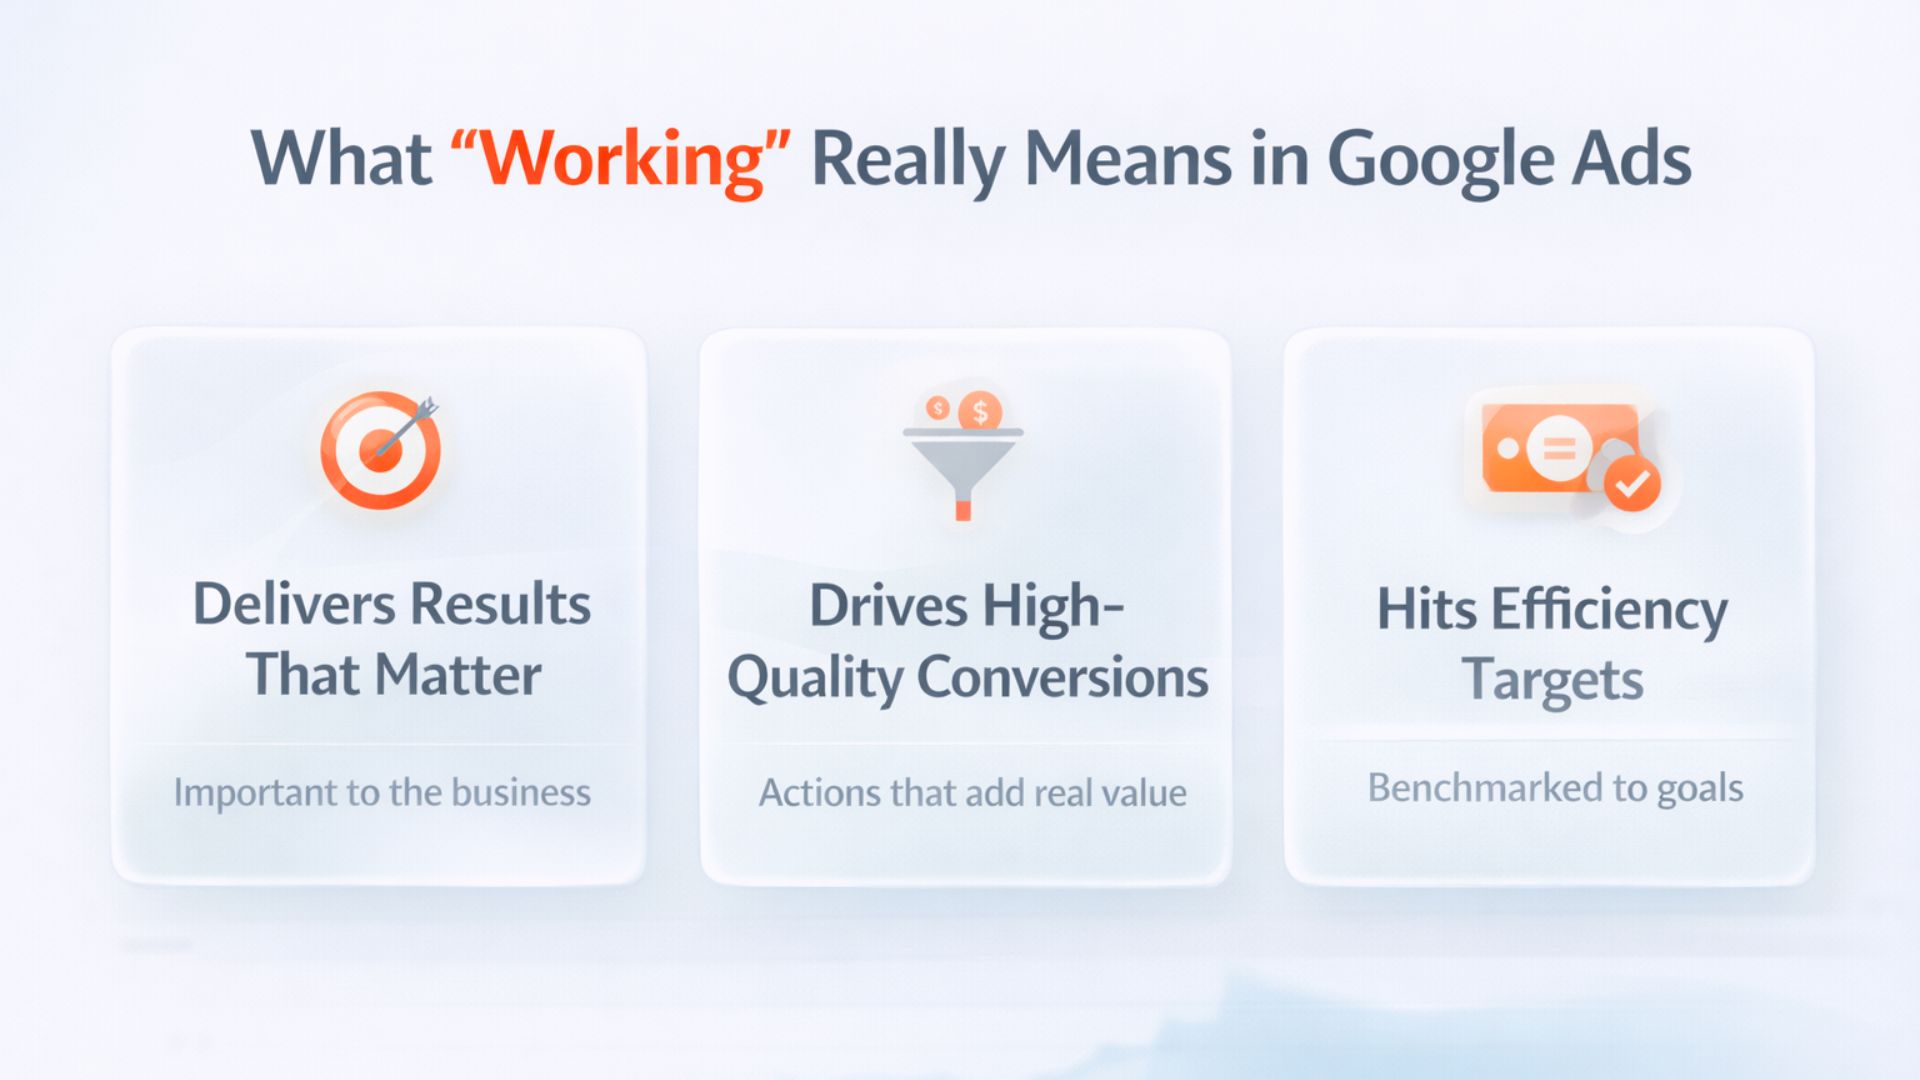
- Is it delivering results that matter?
- Is it driving higher-quality actions (like conversions or revenue)?
- Is it cost-effective compared to benchmarks and business goals?
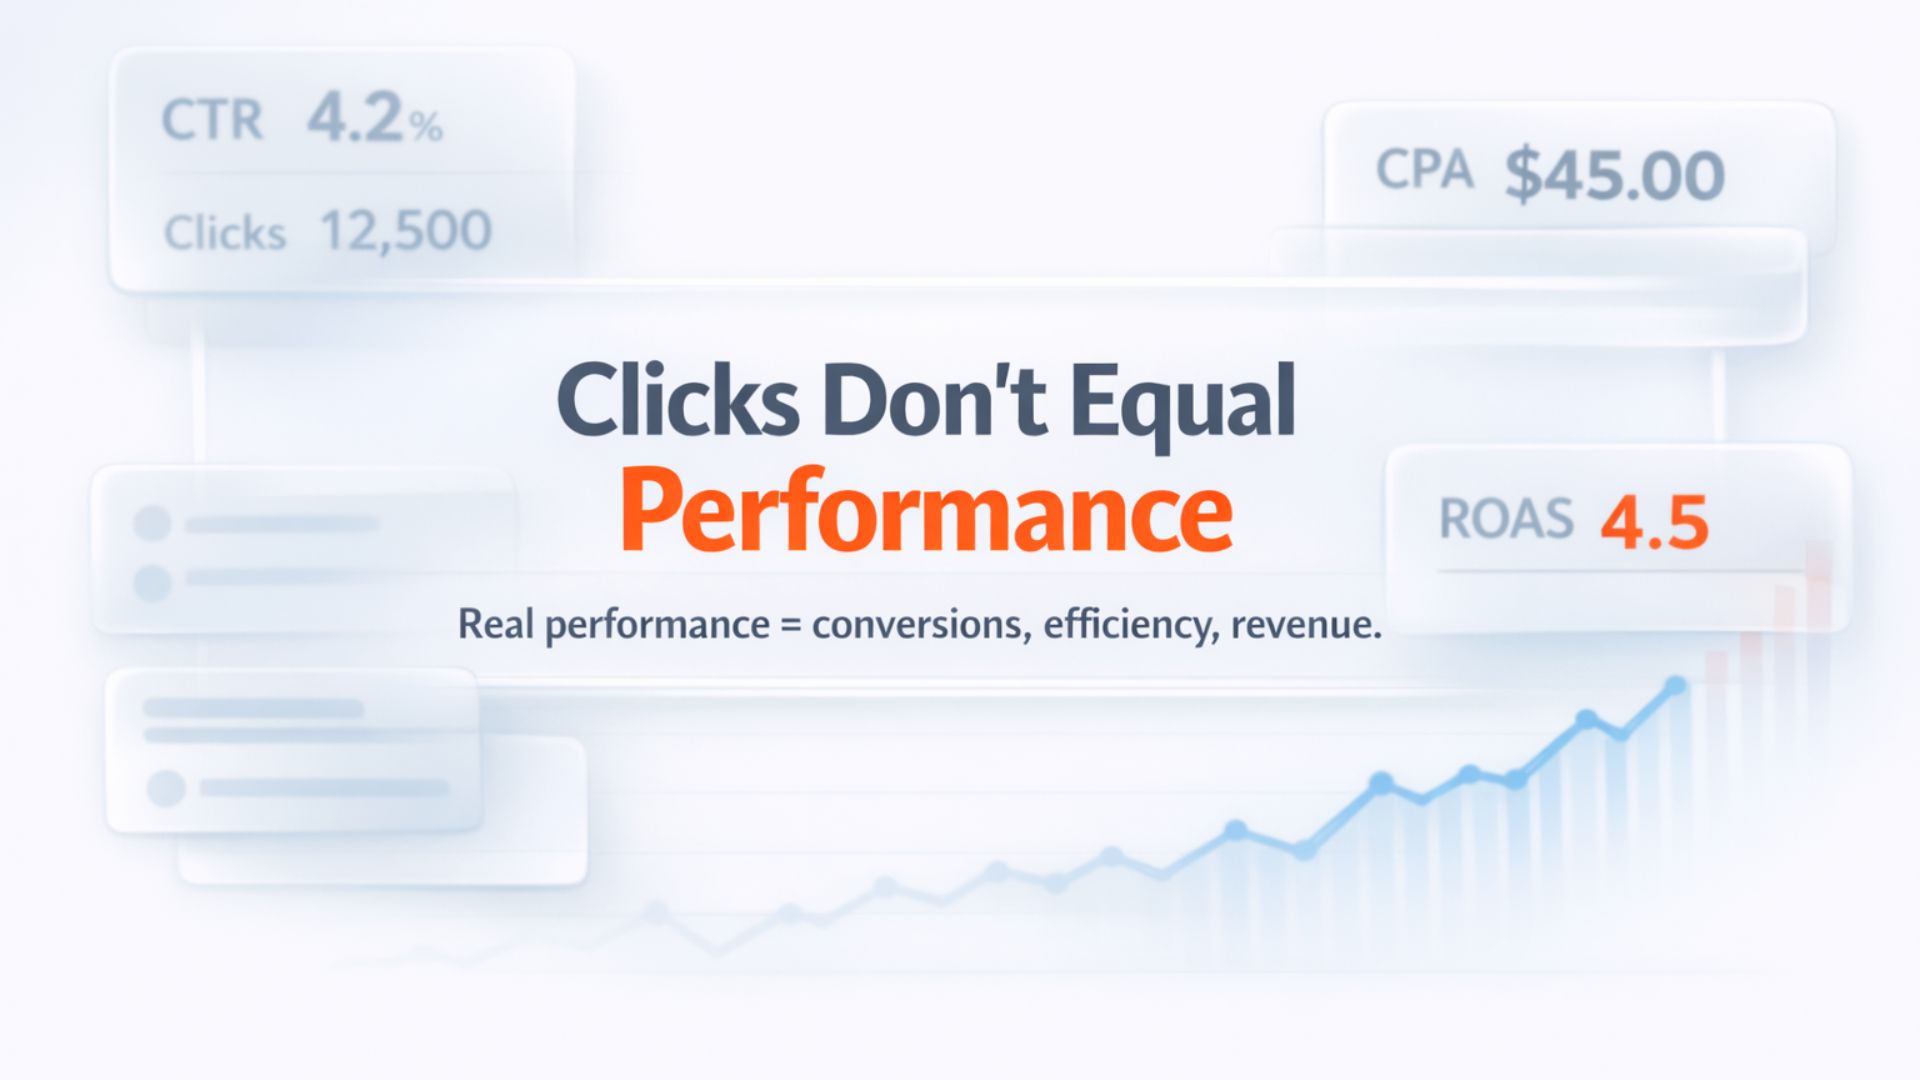
Metrics like clicks and impressions are only part of the picture. They tell you whether an ad was seen and clicked but not whether that click led to meaningful outcomes.
This is why top performance marketers emphasize conversion-focused KPIs over surface-level engagement numbers.
The Core Problem: Data Without Direction
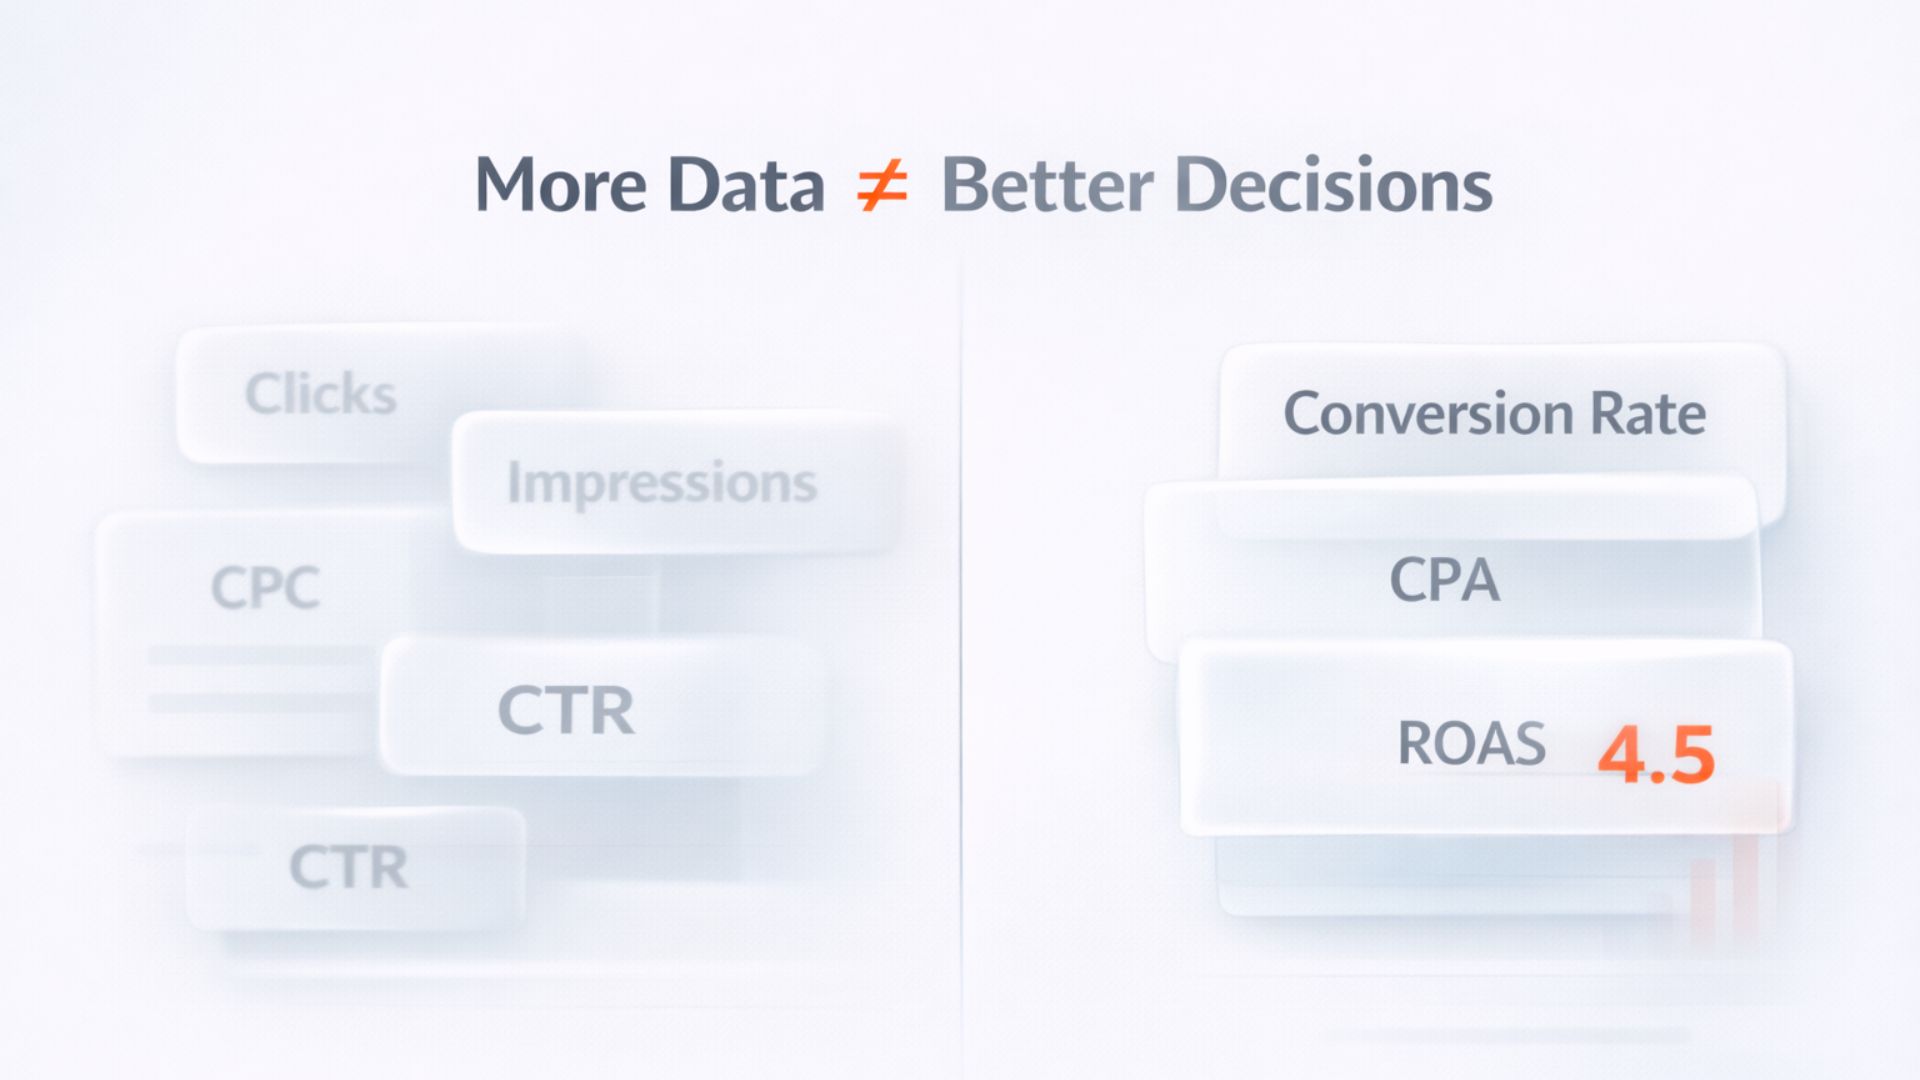
Most campaigns fail not because of a lack of data, but because marketers don't interpret it correctly. Google Ads gives you lots of numbers (clicks, impressions, CPC, CTR) but unless you connect those numbers to goals like conversions or revenue, you won't know what's actually working.
For example:
- A campaign with lots of clicks but low conversion rate might be attracting unqualified traffic.
- A campaign with a high cost per click but strong ROI could still be worthwhile.
- Impressions may be high, but if those impressions don't translate into valuable actions they aren't working.
Too often, teams fall into the trap of celebrating surface-level metrics, which can mask poor performance deeper in the funnel.
What Metrics Truly Reveal Performance
Here are the core signals that help you answer whether your campaigns are really working, backed by industry standards and expert guidance:
Conversion Rate (CVR)
This shows the percentage of users who completed the desired action (purchase, sign-up, lead form). Higher conversion rates usually indicate more effective campaigns.
Cost Per Acquisition (CPA)
CPA tells you how much you're spending to gain one conversion. If your CPA is lower than what's profitable for your business, the campaign is likely working.
Return on Ad Spend (ROAS)
ROAS measures revenue generated per dollar spent on ads. Strong ROAS means your campaigns are profitable.
Click-Through Rate (CTR) & CPC
CTR and CPC help you understand engagement and competitiveness, but should be judged alongside conversions. A high CTR with low conversions means you're attracting clicks but not meaningful outcomes.
Quality Score & Search Terms
Quality Score gives insight into relevance between your ads, keywords, and landing pages. Use the search terms report to align your keyword strategy with actual user behavior.
Use Benchmarks and Data to Inform Decisions
Industry benchmarks help you compare performance in context. For example:
The average cost per lead in Google Ads in 2025 was about $70.11, with strong variation across industries.
Knowing where your metrics fall compared to standards helps determine whether performance is genuinely strong or underperforming.
Tools & Techniques for Accurate Analysis
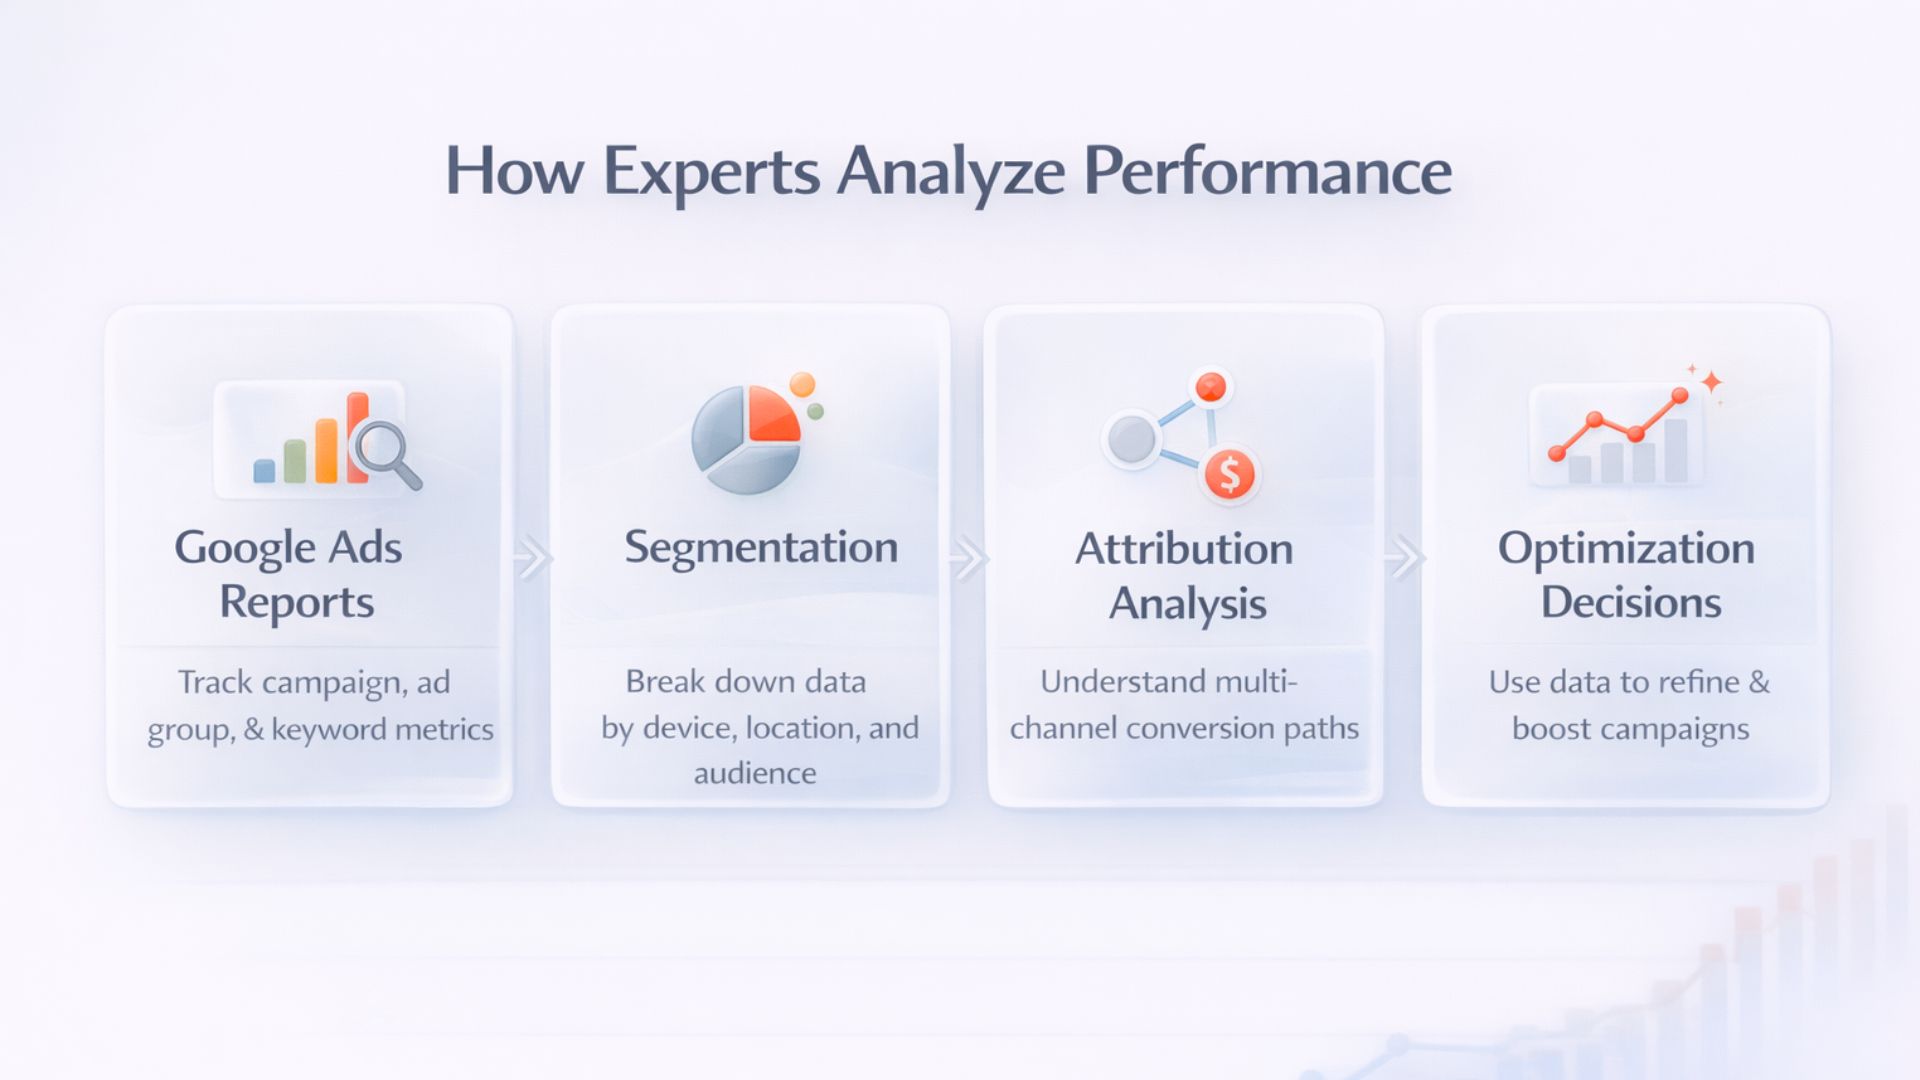
To accurately assess what's working, most experts recommend using:
Google Ads Reports
Dive into campaign, ad group, and keyword performance using built-in reports. Link with Google Analytics to understand user behavior after clicks.
Segmentation
Break your data down by device, location, and audience segments to see where performance differs.
Attribution Analysis
Understand how Google Ads interacts with other channels. Sometimes paid clicks assist conversions rather than directly drive them.
What to Do When Things Aren't Working
If your campaigns aren't hitting your goals:
- Revisit your KPIs — are they aligned with business outcomes?
- Update targeting and keywords based on search terms data.
- Adjust bidding and budget allocation to support high-performing segments.
- Test and optimize creatives and landing pages to improve engagement and conversion.
The key is continuous evaluation and iteration, not one-time reporting.
Final Takeaway
Understanding what's working in Google Ads isn't about having more data — it's about having the right data and interpreting it in the context of your goals.
Focus on conversion-related metrics like CPA, ROAS, and conversion rate, compare them with industry benchmarks, and use analytics tools to uncover deeper insights.
With the right perspective and structured analysis, you can confidently optimize your ad spend and drive better business results.
See how Adlyse identifies what's working, instantly, across every client account.
Turn analysis time into margin.