

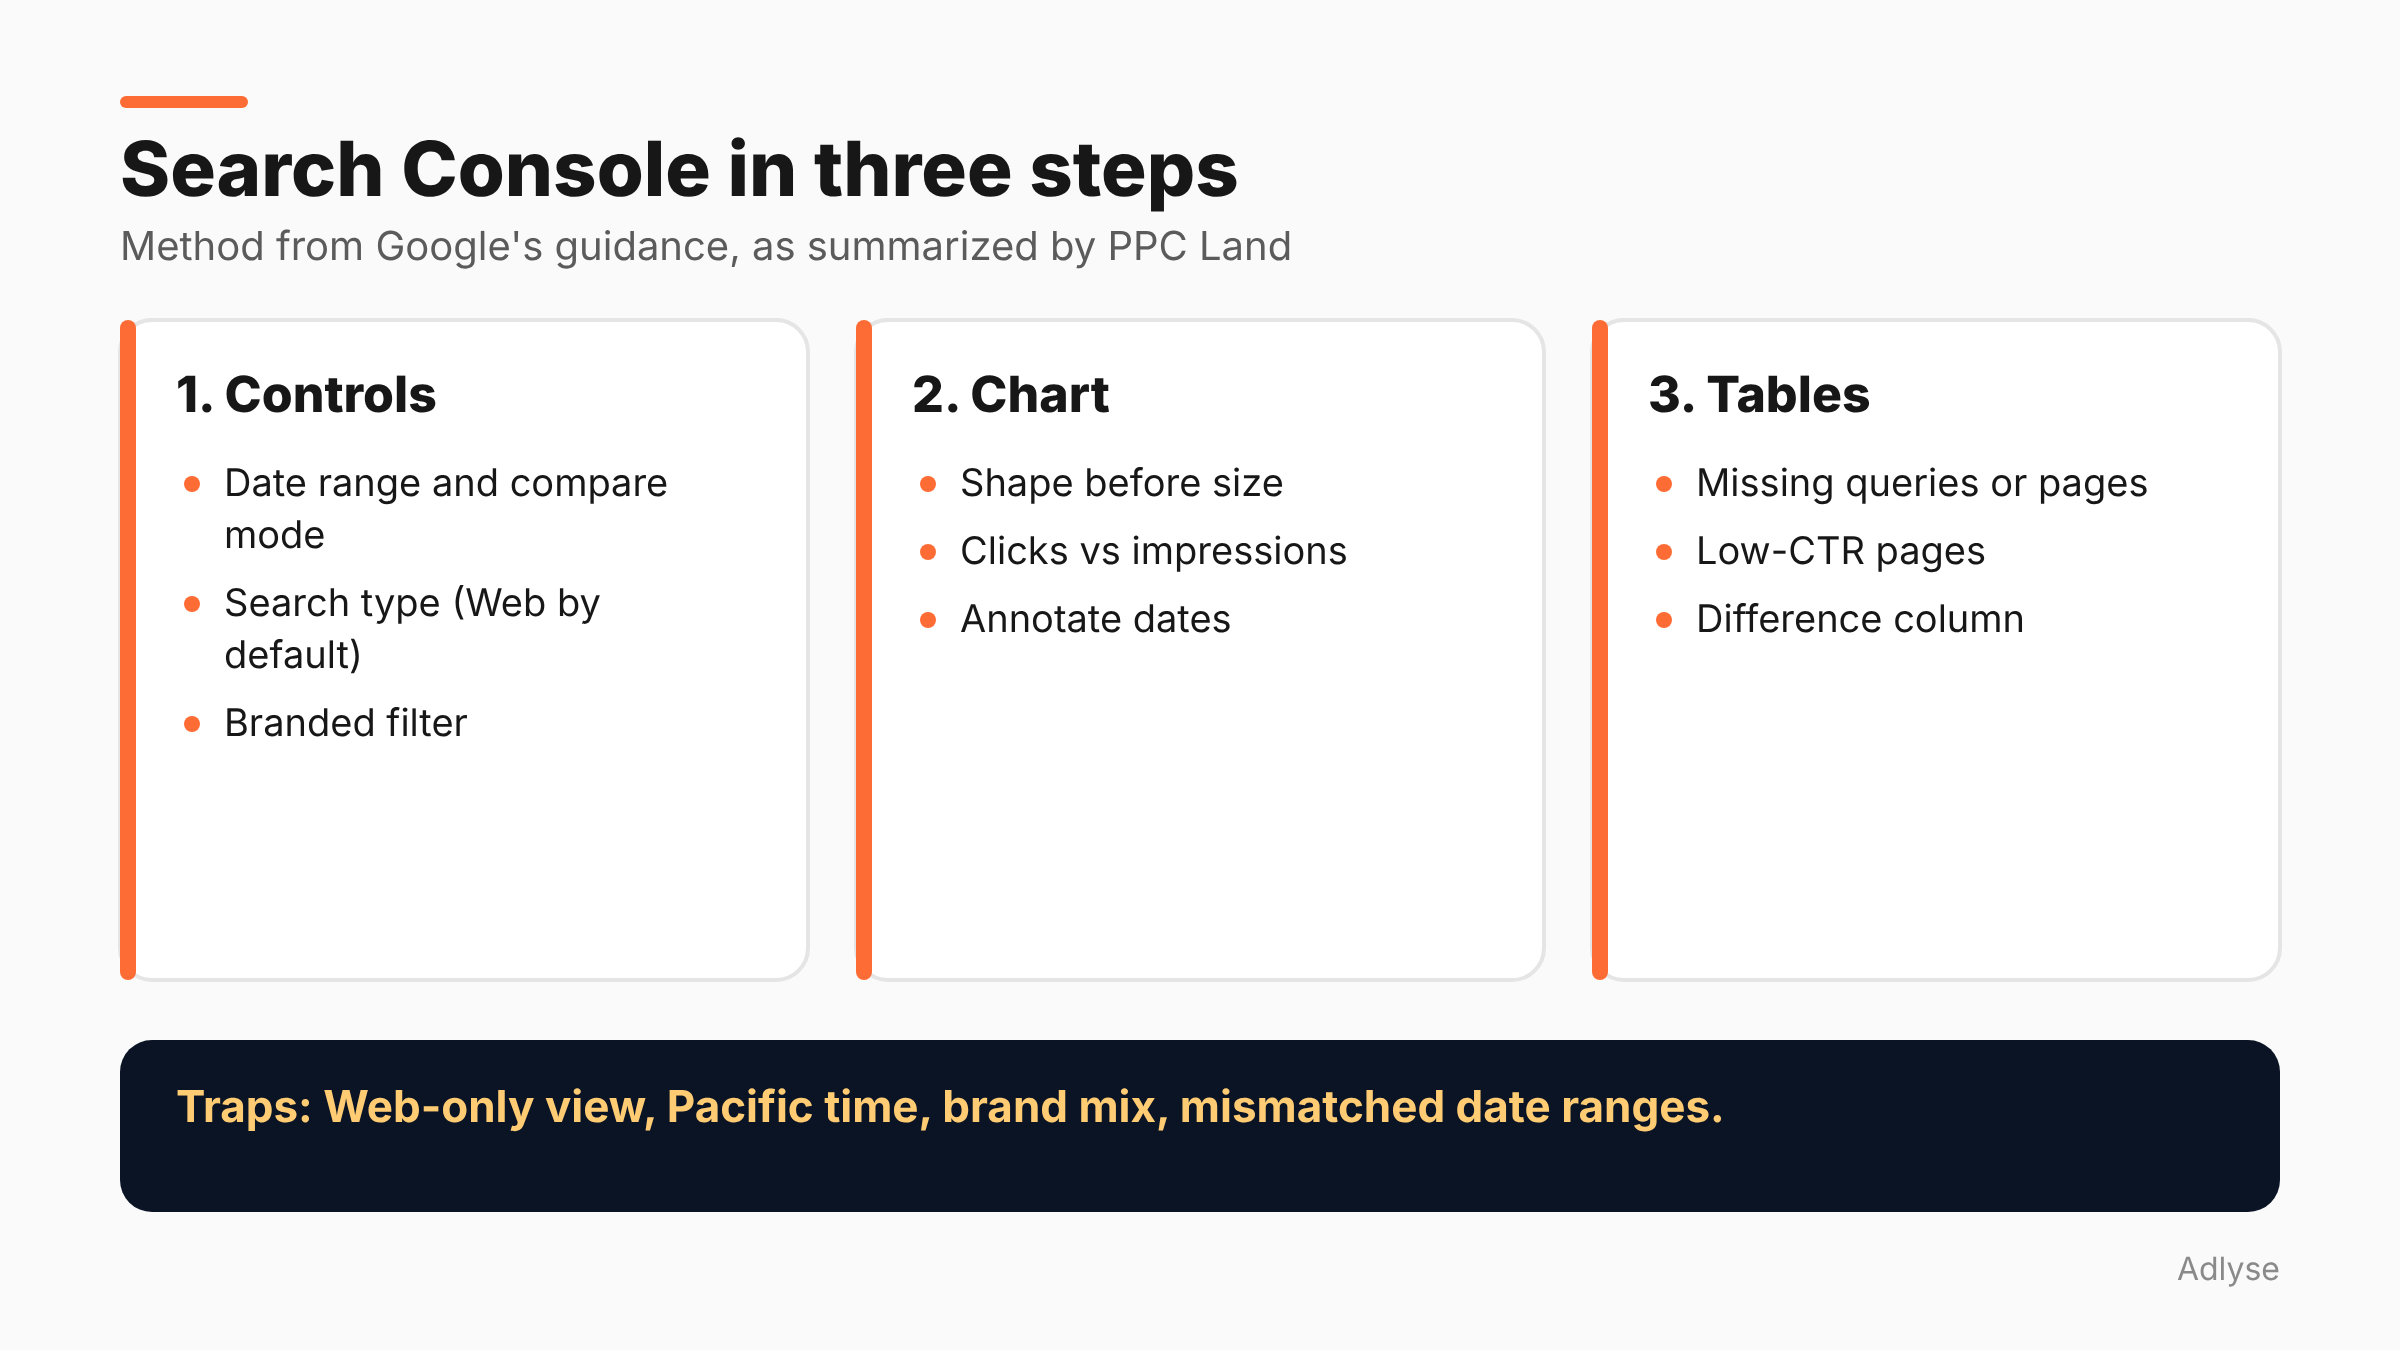
Google's Search Console guidance reads the Performance report in three steps: check the data controls and filters, review the chart, then examine the tables. Most wrong calls come from skipping step one, such as reading a Web-only chart as if it were all of Google. This post walks through the method, with the traps that matter for a busy season.
What is the three-step method?
PPC Land summarizes Google's guidance from a video by Daniel Waisberg, a Google Search Advocate. The three steps are:
- Check the data controls and filters.
- Review the chart.
- Examine the tables.
The same source says Waisberg's video is the closest Google source it links, and gives no URL to Google's official documentation. We could not find the video's exact date. PPC Land's page shows conflicting dates, one stating December 4, 2024 and metadata showing December 6, 2025, and it suggests 2025 is more likely. So treat this as established guidance, not new this week.
Google's own help page, Performance report: common tasks and use cases, covers the same ground, and we opened it directly.
What should you check in the controls?
Per PPC Land's summary, three reports sit in Search Console: Search Results (with Web, Image, Video and News tabs), Discover, which appears only above a minimum impression threshold, and News, which covers news.google.com and the Google News app, excluding the News tab in Search.
Then check these controls before you read a number:
- Date range. The default is three months. You can choose 28 days, seven days or 24 hours, with hourly data for the 24-hour view. Most dates use Pacific time.
- Compare mode. Compare periods, such as this month against last month, or against the same month last year.
- Search type. Charts default to Web only. If traffic comes from images, video or news, check those tabs.
- Branded and non-branded filters. These separate queries that mention your brand from those that do not.
Google's help page adds that the branded filter has data since March 11, 2025, and is not available for sub-properties or sites with low impressions.
What are the traps in the controls?
This section is our opinion, built on the controls above.
The Web-only trap. If a chart shows a drop, check whether the search type is Web. A rise in image or video traffic can hide behind it.
The Pacific time trap. If you compare Search Console with an analytics tool set to another time zone, days will not line up, especially for hourly data.
The brand trap. A rise in clicks can be entirely branded, driven by a sale, an email or paid ads. Split it before you celebrate or panic.
The date-range trap. Comparing a sale week with a normal week will always show a change. Compare like with like. During the November 2026 core update, Google's documentation says to wait at least a full week after completion before comparing; see our post on reading the update during Black Friday.
How do you review the chart?
Look at the shape before the size. Is a change sudden or gradual? Did it happen on one day or across a period? Did it affect clicks and impressions together, or only one?
PPC Land reports that you can right-click a chart date to add an annotation of up to 120 characters. Use it. Note your sale dates, site releases and Google update dates. An annotated chart is worth more than a clean one, because in three months nobody will remember what happened on a given Tuesday.
A few reading rules, also our opinion:
- Clicks without impressions moving suggests a change in click-through rate, perhaps from titles or snippets.
- Impressions without clicks moving suggests a change in visibility, rankings or the result page layout.
- Both moving together suggests demand or ranking change. Check the season.
How do you examine the tables?
The tables break the chart into queries, pages, countries and devices. PPC Land's summary of Google's guidance gives these readings:
- Expected queries missing may mean the site lacks relevant content.
- Expected pages missing may point to technical issues, which the URL Inspection tool can help diagnose.
- High impressions with low click-through rate may call for better titles, images or structured data.
Google's help page adds practical moves. Sort the Queries or Pages tab by clicks, CTR or impressions. Query matches are exact and case-insensitive, so regular expressions can group similar searches. Sort pages by ascending CTR to find pages that may need better titles and descriptions. Use the Difference column to spot large changes. Page-level totals can differ from property-level totals.
For position, Google's help page says to put more weight on impression and click trends than on average position. That is worth remembering when someone sends you a position screenshot.
What about AI features?
PPC Land says AI Mode data is merged into Web totals, so it cannot be isolated from traditional search results in the main report. Google also has a separate Generative AI performance report, which shows impressions but not clicks. See our post on what that report can't tell you.
If your clicks fall and you wonder whether AI features are the cause, this report cannot answer it alone. Use it with analytics and a change log.
How do you diagnose a traffic drop?
Google's help page points to a separate guide for diagnosing drops. Here is a short routine of our own that follows the three steps:
- Controls: set the same date range and search type for before and after. Add the branded filter.
- Chart: find the first day of the change. Match it to an annotation or a known event.
- Tables: compare pages and queries for the two periods using the Difference column. Look for a few pages that account for most of the drop.
- Technical check: inspect the affected URLs, and check recent releases.
- Cross-check: compare with analytics sessions and backend orders.
- Decide: if it is seasonal, note it. If it is technical, fix it. If it matches a Google update, wait for the update to finish before changing content.
A rank tracker can add context, but it should not overrule Search Console. See why in our post on rank tracker noise during a core update.
How should agencies report from Search Console?
Report one chart, one table and one note. The chart shows clicks and impressions over time with annotations. The table shows the five pages or queries that changed most. The note says what is known, what is not and what you will do next.
Put the method at the bottom of the report: date range, search type, filters and time zone. That way, if a number looks different next month, the client can see why. For the same reason, agree in writing which filters you use for branded and non-branded.
For paid reporting, apply the same discipline. Our post on why cross-platform numbers don't add up explains how filters and windows create differences.
What are the limits of this method?
- It is a summary of a summary. The three-step method comes from PPC Land's reading of a Google video. Check it against the video and the help page.
- Search Console is not analytics. It shows search performance, not sessions or sales.
- It is limited data. Some queries are anonymized, and tables have row limits.
What should you do next?
Open your Performance report and write down the four controls you currently have set: date range, search type, filters and compare mode. If you run changes through Adlyse, each approved change ships with a hypothesis and is graded improved, hurt or neutral. Use annotations the same way: record the change and the expected effect on the chart.